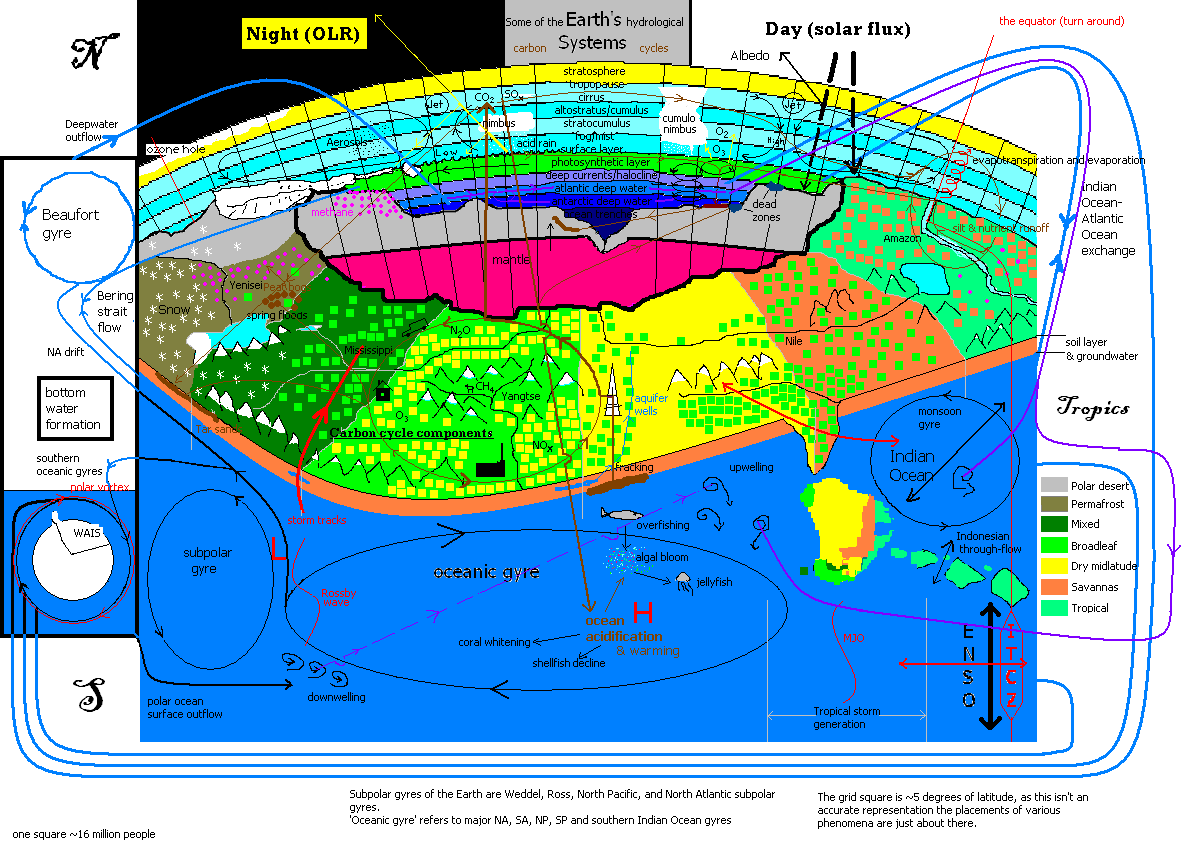
Presume the climate system of the earth is a heat engine and draw a simple image of how the heat engine distributes the energy between the components of the engine including internal variation, some effects of it and human influence on it using at maximum 1200*854 pixels:
Task not complete since the map doesn't include the real topography of the earth, the directions on many lines and there is a serious lack of explanations on many processes. I guess this takes a bit more pixels.
2 comments:
List of things stuffed in the image
solar flux - albedo - evaporation/convection - Hadley cell- Polar cell - Hadley cell - ITCZ - Cloud layers - rain - ocean - crust - mantle - continent - snow/rain - ice sheet - ice shelf - WAIS - sea ice - lake ice - rivers - nutrient/silt runoff - spring floods - oceanic gyre - downwelling - bottom water formation - Deepwater outflow - ocean layers - subpolar gyre - polar ocean surface outflow - upwelling - Meridional overturning circulation - soil layer - groundwater - biomes - fossil fuels (oil, coal, natural gas) - ENSO - tree/snowline - monsoon gyre - monsoon - MJO - Tropical cyclones - natural ozone - Rossby wave- Storm tracks - polar vortex - high altitude jet streams - Climatological highs & lows (Polar ones are missing) - Beaufort Gyre - Indonesian through-flow - Bering strait flow - algal bloom - jelly fisn - fish - CH4 - Tar sands - Peat bogs - fields (or the amount of people in 2011) - aquifer wells - parts of carbon cycle (CO2) - SOx - acid rain - ground ozone - N2O - traffic - NOx - ozone hole - housing - factories - Aerosols - fracking - OLR
There maybe others present, I wasn't actually counting when I was making this
And now I wasn't proofreading the 2nd Hadley is of course Ferrell.
Post a Comment