Friday, March 21, 2014
Book of ages, parts 28-23.5, illustration
(I think Pleistocene begins at 23.5)
'Kids, would I get some attention? ... ... Thanks. What I have here to show you is an image of the subject of the couple of stories you're next about to hear. This image has been passed to me by the elders and I think it's been originally done two ages ago, maybe three. I'm sorry, it has been scribbled over by some jokesters, so it's not something you need to copy and remember as such. There are more pure and more complex versions of this image available in the public library, though you cannot loan them they're there for you to see, if you want. Just remember that they are not all the same. Even nowadays some smart people over in the larger schools for young adults during their wanderyars argue which are the best versions so don't bother to argue between yerselves over this. You remember last time we talked of long-gone monsters. Now it's time to hear how monsters vanished and how animals appeared.'
https://drive.google.com/file/d/0B34nFtPgUZzjdTBvNTVNcWNSc2s/edit?usp=sharing
Sunday, March 9, 2014
book of ages, intro.

Thursday, January 9, 2014
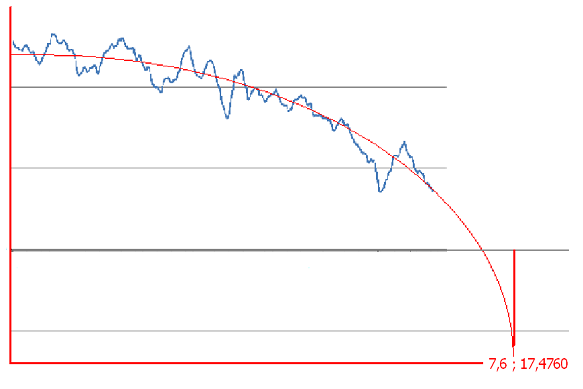
Wiggle Matching (was:brutality)

Tuesday, December 31, 2013

Thursday, December 19, 2013
lanl (los alamos national lab) seeking a professional
who is very good at programming and analysing high-dimensional Bayesian Networks (partly hierarchial or fully hierarchial depending how you look on things) with non-linear and time-dependent relationships to evaluate the more scientific physical models of climate and to seek potential improvements via statistics in some of these, on areas that are hardest to model with strict physical equations [IOW, make some black-box surrogate models less black]. please note the results of your work are not necessarily implemented on running systems, so do not be a dick with your fellow workers who most likely know their specific subject better than you. statistics is usually only a tool to get better results, but in this position there's a possibility to be a part of cutting edge statistics and science. So, good personal communication skills are required in this highly qualified research group aiming to find the minute errors in physical models arising from the complexity of the real world. military experience not required but a minor advantage (even a pacifist, green activist might be accepted depending on credentials). Bring out and hone your skills in Bayesian multivariate nonlinear statistics with our select crew to better the mankind and understanding of the physical world!
the real ad for the position here:
http://hypergeometric.wordpress.com/2013/12/14/postdoc-position-in-bayesian-climate-uncertainty-modeling/
Wednesday, November 13, 2013
Haiyan scale

based on earlier work seen somewhere in the net. since the B-scale has worked well but ends up at the point where a wooden, well-built ship disintegrates, taking no account to the washed-to-shore iron-hulled fishing boats which still may float someday.
the table in graphical format (no tornado ever has been 11):

Update: Sharing the .ods -file used to make the images. (Hurricane Patricia (2015) with measured measured winds of 175 kt = 5,83 hfws = cat 6) added to the list
https://drive.google.com/file/d/0B34nFtPgUZzjUWhpTl9sQXhzT2M/view?usp=sharing
As can be seen nothing happens at -5 (calm), and at >+5 everything happens.
Theoretically possible would be a category 7 in this scale, as described here: https://robertscribbler.com/2016/07/29/hothouse-2090-category-6-hurricane-a-grey-swansong-for-tampa/
Let's hope it won't get to that.
Haiyan scale
based on earlier work seen somewhere in the net. since the B-scale has worked well but ends up at the point where a wooden, well-built ship disintegrates, taking no account to the washed-to-shore iron-hulled fishing boats which still may float someday.
the table in graphical format (no tornado ever has been 11):
Update: Sharing the .ods -file used to make the images. (Hurricane Patricia (2015) with measured measured winds of 175 kt = 5,83 hfws = cat 6) added to the list
https://drive.google.com/file/d/0B34nFtPgUZzjUWhpTl9sQXhzT2M/view?usp=sharing
As can be seen nothing happens at -5, and at >+5 everything happens.
Theoretically possible would be a category 7 in this scale, as described here: https://robertscribbler.com/2016/07/29/hothouse-2090-category-6-hurricane-a-grey-swansong-for-tampa/
Let's hope it won't get to that.
Subscribe to:
Posts (Atom)